Sunday, May 11, 2014

UAS Field Day 2 and 3

Introduction: Aerial imaging via unmanned aerial systems (UAS) is becoming more and more affordable to the public. Simple digital cameras can be mounted on a kite or balloon, set on a timer to take pictures at intervals, and launched into the air. Of course, more sophisticated systems can be built such as the Y6 shown earlier, but complexity and expense are only obstacles if you want them to be. This exercise involved capturing aerial imagery via balloon and Y6 rotocopter. Each resulting set of photographs were then mosaicked into an orthophoto using Agisoft Photoscan. In normal aerial photos, there is error caused by the angle the camera is taking the image or natural changes in the surface that is being imaged. An orthophoto is an image that has been geometrically correct to remove any error caused by buildings, large changes in the surface, or if the images were taken at an oblique angle. The orthophoto is to scale with the real world objects and scenes photographed where a normal image could be stretched in certain areas. This is important if the images are to be used in any sort of mapping done needing a distance calculation. Agisoft Photoscan is a modeling software that allows images to be loaded and built into an orthophoto and 3D surface based on a generated point cloud. The newly created orthophotos were then georeferenced to the surface imaged with the use of ArcMap.

Study Area: Eau Claire Indoor Sport Complex and Soccer Fields, Eau Claire, Wisconsin

Methods:
Y6 Rotocopter: The Y6 rotocopter is the more sophisticated of the two platforms used to image the area around the indoor sports center. The systems has the necessary autopilot software and stabilization systems to carry a digital camera for the imaging. A flight plan was programmed into the autopilot software and Canon- SX260 digital camera was set to take a still image every 2 seconds for the duration of the flight. The resulting photoset held about 500 pictures. Of those 500, 105 were chosen based on clarity and continuity to be mosaicked in Agisoft Photoscan. The resulting orthophoto was then added to the ArcMap document with a satellite base map. Because the GPS on the camera logged in WGS-84, the orthophoto was projected using the “project raster” tool in ArcMap to UTM Zone 15N. The now projected orthophoto was georeferenced to the satellite base map using the “Georeferencing toolbar” in ArcMap. To reference the photo, click the “add control points” button from the Georeferencing toolbar. Then click an area on the orthophoto, such as an intersection, to set a ground control point. Now find and click on the same point on the satellite image. The orthophoto will be stretched to match the points to the points on the satellite image. It helps adjust the orthophoto transparency to help see the satellite image below. After the orthophoto aligns with the satellite image, select “rectify” from the georeferencing menu on the toolbar. This will save the edits made when the image was matched to the satellite base map.
    
Balloon: The balloon was flown at a height of a couple hundred feet. From the tether string, a camera mount was strung and held a Canon-Elph110HS digital camera. The camera was set to snap a still image every 2-3 seconds for 20 minutes. From the picture set, 96 were chosen to mosaic in Agisoft Photoscan. Before mosaicking the images, the GPX track needed to be appended to the images. 

Figure 1: GeoSetter offers a platform that makes linking the GPX track log to the images captured. Having a GPS location with the image improves the accuracy of the later orthophoto.
To assign the GPS location for each image, the 96 images were imported into GeoSetter (Figure 1). By clicking the “synchronize with GPS data file” button on the toolbar, GeoSetter aligned the images with their proper location and saved each image with a GPS coordinate. Now that the images have a GPS location, Agisoft Photoscan can properly make the mosaic and orthophoto. The orthophoto was then added to the ArcMap project with the satellite base map. The image was projected using the “project raster” tool in ArcMap from WGS-84 to UTM Zone 15N. Then using the same process as before, the image was georeferenced to the satellite image via the georeferencing toolbar. To save the referenced image, select “rectify” from the georeference menu on the toolbar.
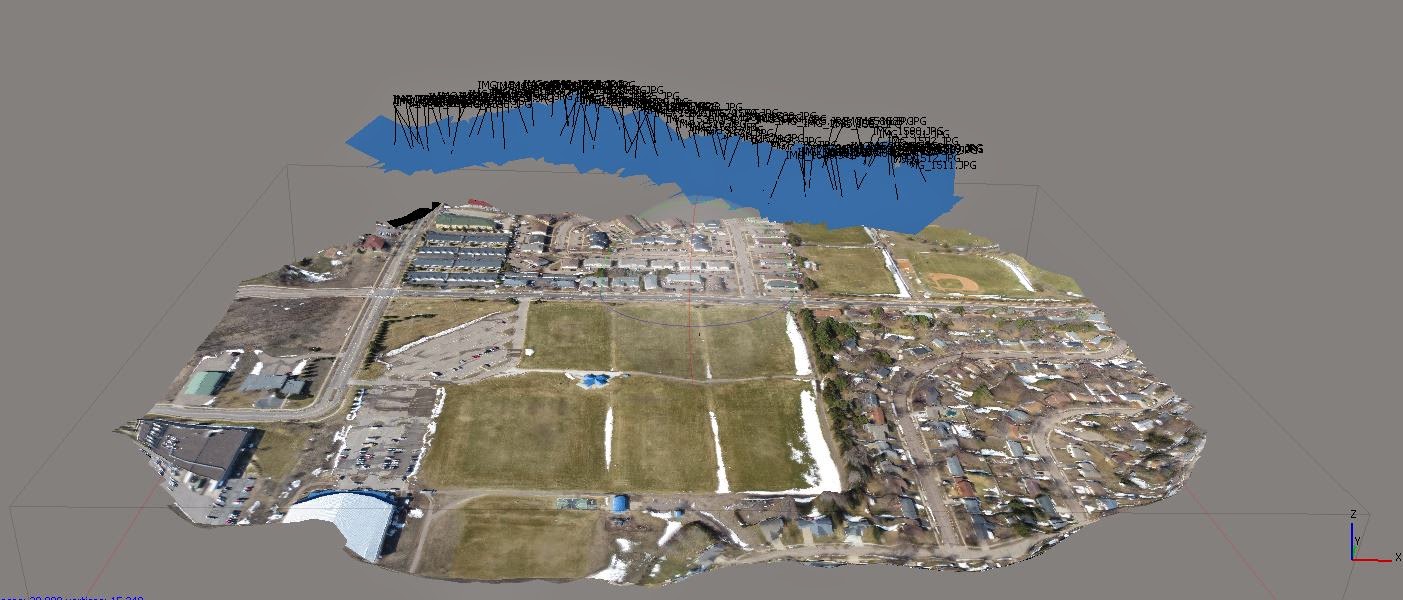
Figure 2: Agisoft Photoscan uses the selected images added in the workspace and creates a 3D model of the surface. The images are linked, allowing the creation of a point cloud which the program uses to model the real world surface. 

Orthomosaic: Agisoft Photoscan was used to create the orthophotos from the collected aerial images. From the workflow tab in Photoscan, select “add photos”. This will bring the photos that will be mosaicked into the workspace. Now from the workflow tab, select “align photos”. The program will form a point cloud using all the images selected in this step. If a high number of images is used, the processing time will take longer. With both platforms using about 100 images each, processing took about 15 minutes. From the newly created point cloud, select “build mesh” from the workflow tab. This creates a TIN from the point cloud turning the 2D images into a 3D surface (Figure 2). Now to add the imagery on top of the TIN, select “create texture” from the workflow tab. Once the texture is added, export the orthophoto from the file tab in a TIFF format to be imported in ArcMap for georeferencing.

Georeferencing: Open a new ArcMap project and add a satellite image base map and set the map projection to UTM Zone 15N. Add the orthophoto TIFF created from Agisoft Photoscan. Before referencing, use the “project raster” tool to project the TIFF from WGS-84 to UTM Zone 15N. This will make the referencing process a little simpler and more accurate. Now to start referencing, open the Georeferencing toolbar from the customize tab in ArcMap. On the toolbar, make sure the TIFF is listed in the drop down box and select “add reference points”. Using the tool, click an area on the TIFF and match that spot to that of the satellite base map. Change the transparency of the TIFF to about 30% to help locate features such as intersections or corners of buildings to help accuracy. Repeat this process of clicking the image, clicking the satellite base map until the image matches the base map. Once the image matches, select “rectify” from the georeferencing drop down menu on the toolbar. This will save a new image that will now be georeferenced.
   
Results:
Figure 3: The georeferenced (bottom) and original orthophoto (top) comparison show how georeferencing can have a big impact on scale of an area imaged.
Y6 Rotocopter: The resulting orthophoto from Photoscan was clear and representative of the survey area. It took 15 ground control points when georeferencing to match the orthophoto to the satellite image (Figure 3). The edges experienced the most distortion especially noticeable in the residential areas.
Figure 4: Comparison of before and after georeferencing for the balloon imagery. The bottom image is georeferenced where the top is still disoriented in space over the map. 
Balloon: The orthophoto created from the balloon imagery was too distorted more on the edges of the image than the interior. The image was referenced using 8 ground control points on the images. Although it took less points to correct the balloon image, there was more discrepancies originally than in the Y6 orthophoto.

Figure 5: The Y6 has a compensation rig that allows the digital camera, while engaged in photography, to remain parallel with the ground. This keeps distortion in images to a minimum regardless of wind conditions and keeps the camera in a stable position. 
Discussion: The Y6 imagery was finer and more defined than that of the balloon. This may have to do with how the camera was mounted to the platform. The setup on the Y6 was an electric gyroscope that had automatic compensation for changes in the camera angle (Figure 5). If a gust of wind came up, the system automatically kept the camera parallel to the ground. The balloon’s camera was mounted using string and a couple brackets purchased at your local hardware store for under 5$. The rig kept the camera level but there was no way to compensate for wind gusts since it was attached directly to the string of the balloon. The Y6 camera also had the ability to automatically geotag each image collected during the flight. The balloon images had to later be processed using the GeoSetter software to link the GPX file captured on the rig to the images collected in the same location. If the balloon images were mosaicked without geotagging the images, the resulting orthophoto was displayed off the west coast of the Galapagos Islands in ArcMap, even after the correct projection had been defined. 
Figure 6: Without geotagging the balloon imagery before mosaicking, even with the defined projection, the orthophoto is displayed off the coast of the Galapagos Islands (red circle) instead of over Eau Claire, WI (green circle)
Even with the automatic tagging for the GPS locations, the cameras collect in WGS-84. It is important to remember this to correct the projections before you georeference it. The varying displays from different projections by the satellite base map could distort the accuracy of the referencing. Overall the Y6 performed more reliably but this exercise proves that even with a low budget, it’s possible to collect suitable aerial images to help map and survey locations.

Saturday, May 10, 2014

Navigation 3: GPS and Map Race

Introduction: Navigation with GPS systems has definitely become more mainstream with the option of dashboard systems. Most new vehicles today have options for turn-by-turn navigation giving the appearance that GPS systems are rarely wrong. GPS systems in vehicles are more reliable than handheld systems but still need to be used with common sense. Handheld systems are dependent on strong satellite signals. With weak signal due to cloud cover, dense vegetation, or tall structures, accuracy can be very limited. When navigating with a GPS, it is always good practice to have a map also as a reference in cases of low satellite signal or lost signal. For this navigation exercise, a Juno GPS unit and a map were used to navigate all 15 points of the Priory Navigation Course. To add a little incentive, the team who completed the course first received a prize, but all teams were armed with paintball markers. If a team member was hit with a paintball, a 30 second penalty was instituted.

Methods: Using the Priory geodatabase from Dr. Hupy and the maps created for the map and compass exercise, a new base map with all 15 navigation points of the course were added. Then using the digital elevation model provided in the geodatabase, the “slope” tool was used to find areas where the topography had the highest change in slope degree. Being a race, the group wanted to avoid running up and down steep slopes through the woods instead of find the points below and on top of the slopes first. The output feature class of the slope tool was then reclassified using the “reclassify” tool. This allowed areas with similar degrees in the slope to be grouped together and symbolized. The 10  default classes were simplified to 3: high, moderate, and low (Figure 1).  
Figure 1: The slope reclassification from low (green) to high (red) degree is displayed at 70% transparency under the planned path of travel. The starting point (5) was assigned but from there, the path was determined both by nearest point and the path of least resistance either slope change or knowledge of vegetation type. 
After we identified where the areas of the highest sloping terrain were and how to avoid them, we plotted our path starting at the assigned “point 5”.  To test the accuracy of the reported locations of the 15 navigation points, each team had to collect GPS data for every point they reached. In the map document in ArcGIS, an empty point feature class was created to hold the collect GPS points. This feature class needed a point number field, and our group chose to set a domain to restrict the accepted values to 0-15 since there were only 15 possible points. The path, navigation course points, and empty point feature class were then deployed to a Juno GPS which was used as a guide when running the course at the Priory. A paper map was also printed. The reclassified slope feature class, point feature class, navigation path, large Priory paths, and no shooting zones were included to help monitor progress and aid in navigation when GPS strength was low. As an added attribute field for the path feature class, the pace count from each point to the next was calculated in ArcGIS. Right click on the new field in the attribute table and select "calculate field" from the drop down menu. Using the “shape_length” field in the path attribute table, the new pace field was calculated by (shape_length)*(64/100) since the pace count in 100 meters was 64 (Figure 2).  By having each pace count listed on the side of the paper map, this saved time trying to calculate each in the field and still gave a reference on how far we were to travel.
Figure 2: After the new "pace" field was added to the path feature class, the field was calculated with the expression shown above. The shape_length field automatically calculated by ArcGIS was used as a base distance from point to point, then the pace count in 100 meters was used to convert that point-to-point distance to a pace distance. 

Results: Our team navigated the 15 point course in about an hour and a half resulting in a second place finish. The GPS display was helpful to keep on path and the calculated pace count helped keep us within the correct distances. The collected GPS points by the team matched the original navigation points fairly well with the exception of 7, 11, 14, and 15 (Figure 3). Using the measuring tool in ArcGIS, the points collected by the team were measured at most 15 meters different from those reported.  
Figure 3: The collected GPS points are represented by the orange boxes and original point locations are represented by the red circles. Points that were the most different were those in locations with dense vegetation or high variation in slope values. 
Discussion:  
Navigation: The path created by the team worked fairly well in the field. The first half, from points 5 to 3, were all found with little exertion from walking through the woods; however, points 3 to 1 were located in terrain that held gullies and high ridges that were unavoidable. Having this at the end of the course was probably not the best idea, but since we were assigned point 5 to begin we really had no choice.  Point 2 was the hardest location to collect since it was down in the bottom of a steep, deep gully (Figure 1). Obviously the high ground is the place to be in a fire fight, so we nominated a single team member to run down with the Juno to collect the point. No casualties resulted.

Paintball Gear: Carrying a paintball marker while wearing a mask that is fogged up isn’t the easiest way to navigate a course like this. The markers were heavy since the hoppers were high above the top of the marker and the air tanks were bulky in the back. The masks were hot and fogged up after a while, making readability of the map and GPS difficult and walking through the course. The fog also effected how well you were able to see other teams to avoid getting hit and serving the 30 second time penalty. You also had to be fairly close to the opposing team during fire fights to be able to hit them. The trajectory of the paintballs was fairly erratic making accuracy only a wish. The masks weren’t all bad though. They did help by protecting your face from branches and buckthorn while walking through a few of the dense areas of vegetation. 

Juno GPS: The GPS units did make traveling and navigating the course quicker than just the map and compass as previously used. The visual display of the route the group was traveling with the display of our current location allowed us to travel and adjust accordingly to stay on course. When navigating using compass bearing, once you are off the line from point to point, it is difficult to arrive in the correct location to find the navigation point in question. The Juno wasn’t perfect however. Several times, 4, we had to reset the system due to bad satellite signal or hitting a button while running through the woods or shooting our paintball markers at a rival team. The satellite signal could also have contributed to the variation in the point location noted earlier. The points that displayed the largest discrepancy were those in areas where the terrain varied more so than the surrounding areas and the vegetation was dense (Figure 3). The trees, although still without leaves, create an obstacle for satellite signals to be received through making the accuracy of the GPS limited. Also, to reduce the display time for the GPS, we removed the base map from the display. Without having the GPS draw the image each time we moved, this saved display time however we were more dependent on the paper map for reference, which isn’t a bad thing. Carrying the Juno also was a bulky nuisance at times. Between trying to track the path our team was taking to the next point and watch for rival teams, the GPS became a vulnerability. 

Thursday, May 1, 2014

Navigation 2: Map and Compass Orienteering

Introduction: Map and compass navigation has been around for centuries and is the most tried and true form of navigation today. Without the need for a satellite signal, an adventurer can successfully navigate series checkpoints in all types of terrain and land cover. Adventure racing is a new and upcoming outdoor recreation that encompasses hiking/trekking, kayaking, mountain biking, navigation, and running into one cross-country race. No GPS technology is allowed other than a tracker provided by the event planners. The only form of navigation is a map and compass. Being able to quickly map, measure, and locate each checkpoint allows an adventure team to be successful and win the races. For our purposes, we were navigating 6 points in one very local area, where these adventure races can hold hundreds of checkpoints and span several countries. Compass navigation is a simple but very powerful skill set to have in your day to day life.    

Study Area: The Priory, formerly known as St. Bede’s Monastery, was purchased by the UW-Eau Claire Foundation in 2011. The 3-building complex and 112 acres were used as an education facility for the Sisters, and is today home to the Children’s Center and Nature Academy. The UWEC foundation is leasing the land to the University of Wisconsin – Eau Claire which also uses the living quarters as an extension of the residence halls for college students. The surrounding acreage is currently used for nature hikes and a 15 point orienteering course (Figure 1).
Figure 1:  Each of the 15 points of the adventure course on the Priory property are marked by orange and white flags with both numbers and unique hole punchers. There are cards given to each team with a grid to punch at each site.
Community discussions have recently been held on how to further the use of the land surrounding the complex. Ideas discussed include: community gardens, pollinator habitat, use as an outdoor classroom, and many others. The area is mostly oak forest but the lot also holds a large jack pine barren. The building complex is perched atop a plateau while the forests are in the surrounding lowland areas. A small holding pond for the waste water produced by the Priory is also on the property.      

Methods:
Figure 2: The 6 points assigned were plotted on the map using the grid system. Each point was then connected to allow for distances and pace counts to then be calculated. 
Plotting Point Locations: Before heading off into the woods, you need to know where your destinations are. A list of the point location coordinates was provided by Dr. Hupy. Depending on which coordinate system (UTM or Degrees Minutes Seconds) you are going to use, the corresponding point locations needed to be drawn on the map. Using the maps created in the first navigation exercise, the 6 selected points of the 15-point course were plotted using the grid system (Figure 2). The X coordinate is the Longitude so the x-axis of the grid was used to find the horizontal position. Once the x-position was found, the y-coordinate was used to plot the point location. Like the x, the Y-coordinate or latitude of the point location was found using the y-axis of the grid on the map.
Figure 3: Before heading into the woods, the bearing to the location was calculated using the drawn lines and the compass. By using the bearing from the map, the navigator can keep the group in line with the point when traveling through the woods. 
Navigating the course:  The next task was to determine the direction of travel, or bearing, to reach the first point from start. First, a line was drawn to connect the 2 points. Using this line, the compass was laid on the map along this line so the direction arrow was pointing to the destination. Then the bezel or dial on the compass was rotated to align the guidelines on the dial with the North South grid lines on the map (Figure 3). The degree reading aligned with the direction of travel arrow is now the bearing. To reach the point, the navigator turned their body to place the red north arrow in the red “shed” on the dial face of the compass. The pacer determined the distance to the point by converting the map distance to real-world pace determined in the previous navigation exercise. With the bearing and distance now known, the navigator sent the runner out ahead of the pacer. The runner allowed the navigator to line up a path for the pacer to help make counting pace more manageable. Once the pacer reached the calculated distance, the point in question should be within sight distance IF the runner and pacer stayed on line with the navigator’s bearing. After the first point was reached, the same process was repeated to reach the following 5.   
Figure 4: Terrain and vegetation varied across the course from thick under brush in the oak forests (left) to the open pine barrens (right). Depending on what we were traveling and navigating through, the pace counts needed to be altered to compensate.

Results/Discussion: The group overall navigated the 6-point mini course in about an hour and 45 minutes. With the 3-person navigator, pacer, runner scheme it was quick work once a rhythm was established. The points assigned to us were over a variety of terrain and land cover ranging from dense oak forest, pine barren (Figure 4), to open field and relatively flat to deep steep ravines. The third point, point “8”, on the map was located about 50 meters south of the real world location. This lead the next point’s bearing to be off from our map and the group actually overshot the location for point 9 (Figure 5).
Figure 5: Point 8 (left) was given different coordinates than the real world location. The red circle displays the area where the point was actually located. This created problems when navigating to point 9 (right). The group overshot the location and used the intersection noted by the red circle to take a new bearing to point 9.

Using a land mark, the intersection of two roads, a new bearing to the plotted point location for 9 was taken, leading to the real location (Figure 5). The following points, 10,11, were found without any problems. The terrain was difficult to see through, meaning the runner had to keep relatively close for the pacer to see and travel (Figure 6). The thick underbrush also meant having to add several paces onto the calculated values since a direct path wasn’t always an option to travel. It is important to not set the runner too far ahead since the increased distance opens up the possibility of straying from the bearing. If traveling a large distance, the more precise or true to your bearing, the better luck you will have finding the destination.
Figure 6: Steep terrain and thick under brush of briers made visibility and traveling interesting in sections between points 8 and 9.